关于常用的pandas库的部分说明
iloc和loc
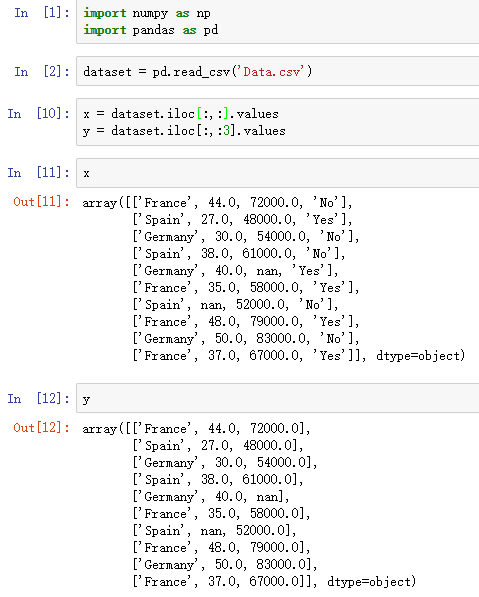
.iloc:根据标签的所在位置,从0开始计数,选取列;[index1,index2],前者是列,后者是行的范围
loc:根据DataFrame的具体标签选取列
读取excel
1 | pd.read_excel(io, sheet_name=0, header=0, names=None, index_col=None, |
https://blog.csdn.net/weixin_38546295/article/details/83537558
Dataframes合并
pandas dataframe的合并(append, merge, concat)
DataFrame结构——行列索引 DataFrame(1):DataFrame结构的详细介绍
pandas中如何选取某几列_【python】pandas中 loc & iloc用法及区别
pandas取dataframe特定行/列
pandas-数据的合并与拼接
pandas apply
https://blog.csdn.net/stone0823/article/details/100008619
Index
如何在pandas中使用set_index( )与reset_index( )设置索引 - 侦探L的文章 - 知乎 https://zhuanlan.zhihu.com/p/110819220
Groupby
Pandas教程 | 超好用的Groupby用法详解 - 易执的文章 - 知乎 https://zhuanlan.zhihu.com/p/101284491
数据集划分——交叉验证迭代器
3.1.2. 交叉验证迭代器 https://sklearn.apachecn.org/docs/master/30.html
ShuffleSplit,随机划分,参数包括划分的次数,以及训练集、测试集的比例参数
KFold,分为n折,K-1折训练,1折测试
StratifiedKFold,分层KFold,保证各类的比例
RepeatedStratifiedKFold,重复多次StratifiedKFold
Scikit-learn的K-fold交叉验证类ShuffleSplit、GroupShuffleSplit用法介绍 https://blog.csdn.net/hurry0808/article/details/80797969
1 | from sklearn.model_selection import ShuffleSplit |
计算交叉验证的指标
cross_val_score
使用交叉验证最简单的方法是在估计器和数据集上调用 cross_val_score 辅助函数。
下面的示例展示了如何通过分割数据,拟合模型和计算连续 5 次的分数(每次不同分割)来估计 linear kernel 支持向量机在 iris 数据集上的精度:
1 | from sklearn.model_selection import cross_val_score |
评分估计的平均得分和 95% 置信区间由此给出:
1 | print("Accuracy: %0.2f (+/- %0.2f)" % (scores.mean(), scores.std() * 2)) |
默认情况下,每个 CV 迭代计算的分数是估计器的 score 方法。可以通过使用 scoring 参数来改变计算方式如下:
1 | from sklearn import metrics |
详情请参阅 scoring 参数: 定义模型评估规则 。 在 Iris 数据集的情形下,样本在各个目标类别之间是平衡的,因此准确度和 F1-score 几乎相等。
当 cv 参数是一个整数时, cross_val_score 默认使用 KFold 或 StratifiedKFold 策略,后者会在估计器派生自 ClassifierMixin 时使用。
也可以通过传入一个交叉验证迭代器来使用其他交叉验证策略,比如:
1 | from sklearn.model_selection import ShuffleSplit |
另外一种可选方案是使用一个可迭代生成器作为索引数组产生(train, test) 划分,比如:
1 | def custom_cv_2folds(X): |
保留数据的数据转换
正如在训练集中保留的数据上测试一个 predictor (预测器)是很重要的一样,预处理(如标准化,特征选择等)和类似的 data transformations 也应该从训练集中学习,并应用于预测数据以进行预测:
2
3
4
5
6
7
8
9
10
> >> X_train, X_test, y_train, y_test = train_test_split(
> ... iris.data, iris.target, test_size=0.4, random_state=0)
> >> scaler = preprocessing.StandardScaler().fit(X_train)
> >> X_train_transformed = scaler.transform(X_train)
> >> clf = svm.SVC(C=1).fit(X_train_transformed, y_train)
> >> X_test_transformed = scaler.transform(X_test)
> >> clf.score(X_test_transformed, y_test)
> 0.9333...Copy
>
>
Pipeline可以更容易地组合估计器,在交叉验证下使用如下:
2
3
4
5
6
> >> clf = make_pipeline(preprocessing.StandardScaler(), svm.SVC(C=1))
> >> cross_val_score(clf, iris.data, iris.target, cv=cv)
> ...
> array([ 0.97..., 0.93..., 0.95...])Copy
>
>
cross_validate 函数和多度量评估
cross_validate 函数与 cross_val_score 在下面的两个方面有些不同 -
- 它允许指定多个指标进行评估.
- 除了测试得分之外,它还会返回一个包含训练得分,拟合次数, score-times (得分次数)的一个字典。 It returns a dict containing training scores, fit-times and score-times in addition to the test score.
对于单个度量评估,其中 scoring 参数是一个字符串,可以调用或 None , keys 将是 - ['test_score', 'fit_time', 'score_time']
而对于多度量评估,返回值是一个带有以下的 keys 的字典 - ['test_<scorer1_name>', 'test_<scorer2_name>', 'test_<scorer...>', 'fit_time', 'score_time']
return_train_score 默认设置为 True 。 它增加了所有 scorers(得分器) 的训练得分 keys 。如果不需要训练 scores ,则应将其明确设置为 False 。
你还可以通过设置return_estimator=True来保留在所有训练集上拟合好的估计器。
可以将多个测度指标指定为list,tuple或者是预定义评分器(predefined scorer)的名字的集合
1 | from sklearn.model_selection import cross_validate |
或作为一个字典 mapping 得分器名称预定义或自定义的得分函数:
1 | from sklearn.metrics.scorer import make_scorer |
这里是一个使用单一指标的 cross_validate 的示例:
1 | scores = cross_validate(clf, iris.data, iris.target, |
GridSearchCV
cross_validate和GridSearchCV https://blog.csdn.net/weixin_41712499/article/details/82882542
机器学习(四)——模型调参利器 gridSearchCV(网格搜索)
Scorings性能指标评价
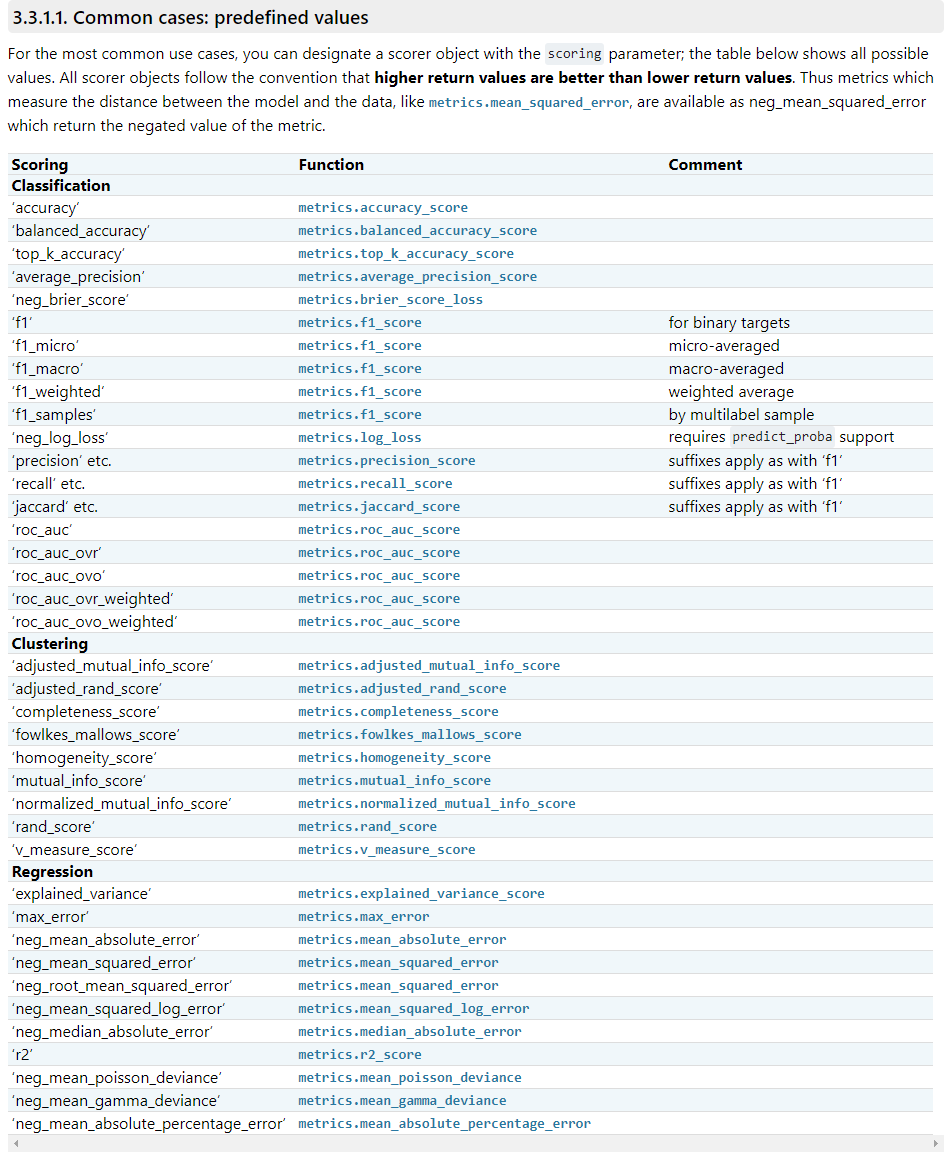
官方手册:https://scikit-learn.org/stable/modules/model_evaluation.html#scoring-parameter
3.3.1预定义的Scorings,3.3.2计算的函数
各类性能指标详解
基础指标
正确率accuracy,tp+tn / all
balanced_accuracy,(recall+sensitivity)/ 2 ,详见
sklearn.metrics.balanced_accuracy_score,以及,评价指标 balanced accuracy
差准率precision,tp / tp+fp
平均精确度average_precision_score,绘制PR曲线(precision-recall),计算不同的precision取均值,还有mAP,多分类时各个类最后的平均AP
召回率recall,敏感性sensitivity,查全率,tp / tp+fn
特异性specify,tn / tn+fp
F1
f1,2xPxR / P+R,关于F1的各类变种,可见:
思想和实例:多类别分类中Micro-averaging与Macro-averaging的区别
具体的实例:多分类的评价指标PRF(Macro-F1/MicroF1/weighted)详解
以F1为例,但是precision之类的也存在,如
1 | from sklearn.metrics import precision_score |
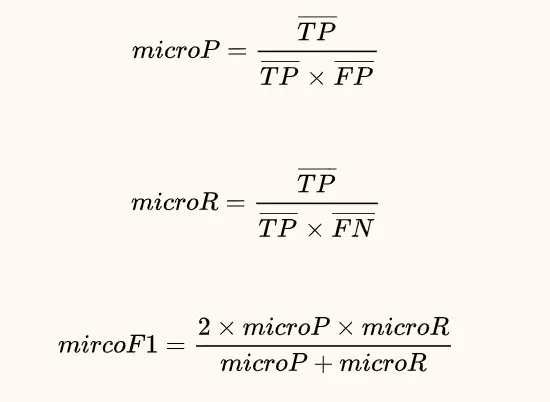
f1_micro,微平均,micro-average
“Micro”是通过先计算总体的TP, FP和FN的数量,然后计算PRF。即先将多个混淆矩阵的TP,FP,TN,FN对应的位置求平均,然后按照PRF值公式及逆行计算

计算所有类别的汇总混淆矩阵,计算相应指标
f1_macro,宏平均,macro-average
“Macro”是分别计算每个类别的PRF,然后分别求平均得到PRF。即对多个混淆矩阵求PRF,然后求PRF的算术平均。公式如下:
计算每一个类别相应的混淆矩阵后,计算相应指标,再取平均
f1_weighted
计算每一个类别相应的混淆矩阵后,计算相应指标,再以类别比重加权求平均
f1_sampled
当样本不均衡时,比如本文举出的样本,中间的0占80%,1和-1各占10%,每个类数量差距很大,我们可以选择加入sample_weight来调整我们的样本。
首先我们使用sklearn里的compute_sample_weight函数来计算sample_weight:
1 | sw = compute_sample_weight(class_weight='balanced',y=y_true) |
sw是一个和ytrue的shape相同的数据,每一个数代表该样本所在的sample_weight。它的具体计算方法是总样本数/(类数每个类的个数),比如一个值为-1的样本,它的sample_weight就是300 / (3 30)。
使用sample_weight计算出的混淆矩阵如下:
1 | >>> cm =confusion_matrix(y_true, y_pred, sample_weight=sw) |
由该混淆矩阵可以得到TP、FN、FP:
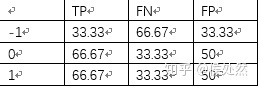
(详解sklearn的多分类模型评价指标 - 侯处然的文章 - 知乎 https://zhuanlan.zhihu.com/p/59862986 )
时间序列数据
判断时间间隔
在pandas里pd.Timedelta的简单介绍及使用方法
获取相应的年、月、日
Python3 pandas库(25) 时间日期高效操作 .dt. - 曹骥的文章 - 知乎 https://zhuanlan.zhihu.com/p/31490318
分箱 pd.cut
数据分箱之pd.cut() - 敲来敲去的文章 - 知乎 https://zhuanlan.zhihu.com/p/143589729