在计算性能指标时,如果仔细观察,会发现PR曲线并不是直接计算ROC,而是AP,average precision,那么他到底有啥区别呢?
PR曲线的AUC和AP/mAP
看了很多,还是有点懵,但不纠结了,先记录下几点吧。。。
结论
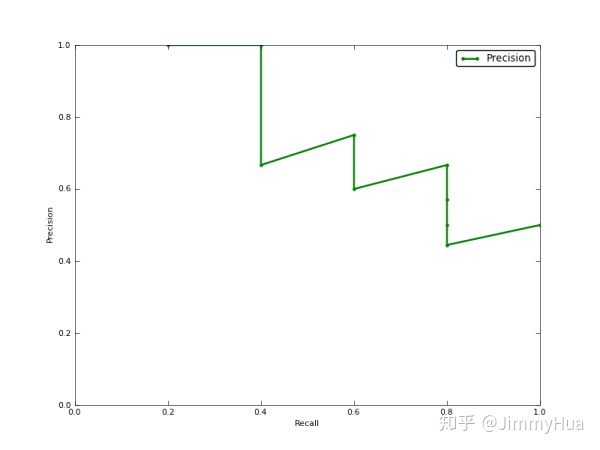
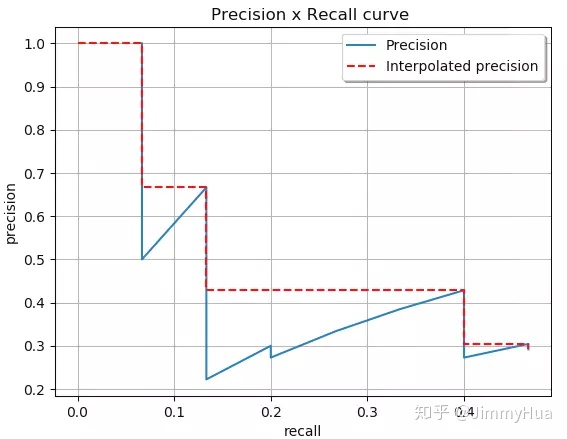
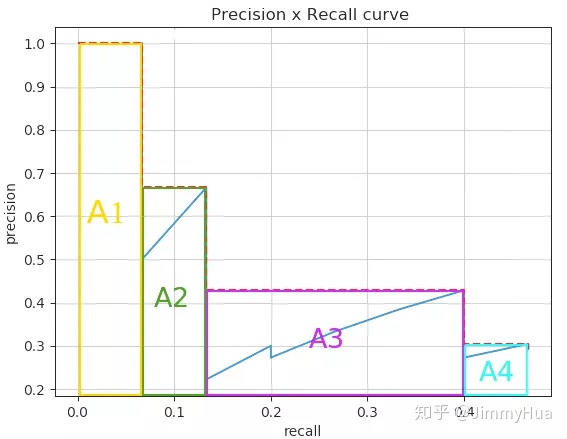
首先,结论是AP算的比PR-AUC来的好,后者常常会高估了真实性能,二者采用的方法可以看下面的example,高估的原因在于一般的PR-AUC所采取的是线性插值的方法,比如第二点会提到的那个VOC比赛,采用的就是插值的方法
官方描述:sklearn.metrics .average_precision_score
sklearn.metrics.average_precision_score(y_true, y_score, **, average=’macro’, pos_label=1, sample_weight=None*)[source]
Compute average precision (AP) from prediction scores.
AP summarizes a precision-recall curve as the weighted mean of precisions achieved at each threshold, with the increase in recall from the previous threshold used as the weight:
where Pn and Rn are the precision and recall at the nth threshold [1]. This implementation is not interpolated and is different from computing the area under the precision-recall curve with the trapezoidal rule, which uses linear interpolation and can be too optimistic.
Note: this implementation is restricted to the binary classification task or multilabel classification task.
Read more in the User Guide.
源码
其实看scikit的源码差别就在于:
AUC-PR 用的trapz直接求积分,就是(precision k - precision k-1)/2 * (recall k - recall k-1)
AP-PR 用的 用的是 precision k * (recall k - recall k-1)
1 | #Parameters |
Example:
1 | from sklearn import datasets |
Use average_precision_score
The average precision (PR AUC) is returned by passing the true label & the probability estimate.
1 | # Average precision score |
Use precision_recall_curve&auc
When using auc function to compute the area under the precision-recall curve, as mentioned earlier, the result is not the same as the value from average_precision_score, but it does not differ too much since the number of data points are large enough to mitigate the effect of wiggles.
1 | # Data to plot precision - recall curve |
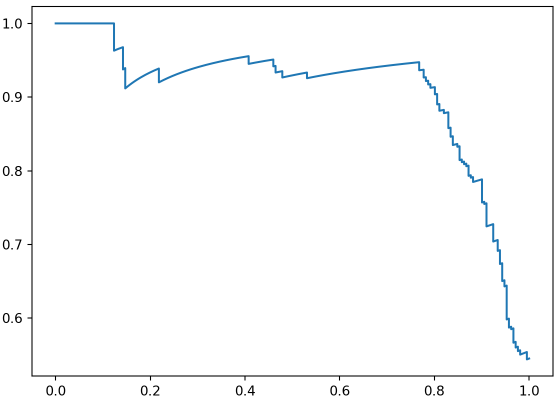
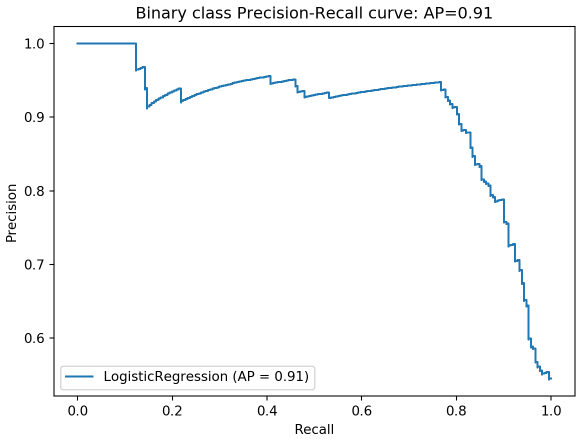
Use build-in function to plot precision-recall curve
In version 0.22.0 of scikit learn, plot_precision_recall_curve is added into the metrics module. It is easy to plot the precision-recall curve with sufficient information by using the classifier without any extra steps to generate the prediction of probability,
1 | disp = plot_precision_recall_curve(classifier, X_test, y_test) |
If you need to compute the area under the curve of precision-recall plot, don’t forget to use average_precision_score to help you get robust result quickly.
- Code examples above are adapted from scikit-learn documentation
example来自:Compute the AUC of Precision-Recall Curve
多分类问题/mAP
是涉及到多分类问题,如VOC比赛里的评判标准,07年采用的11-point方法,10年以后采取的
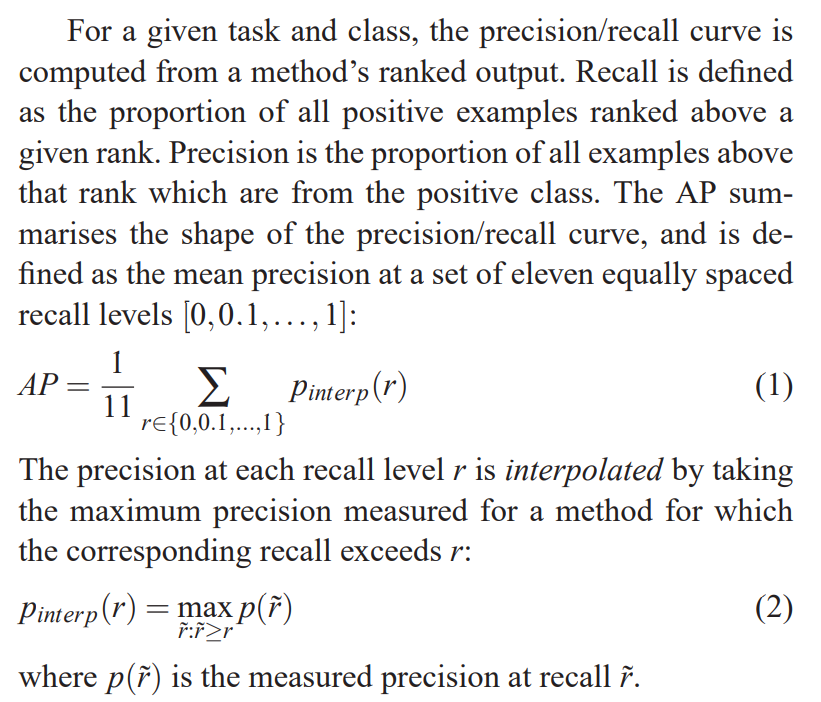
论文出处:M. Everingham, L. Van Gool, C.K.I. Williams, J. Winn, A. Zisserman, The Pascal Visual Object Classes (VOC) Challenge, IJCV 2010.
具体实现:AP,mAP计算详解(代码全解) - JimmyHua的文章 - 知乎 https://zhuanlan.zhihu.com/p/70667071
还有一篇:讲得很好 ReID任务中的CMC和mAP